
![]()
|
|
|
Table of Contents
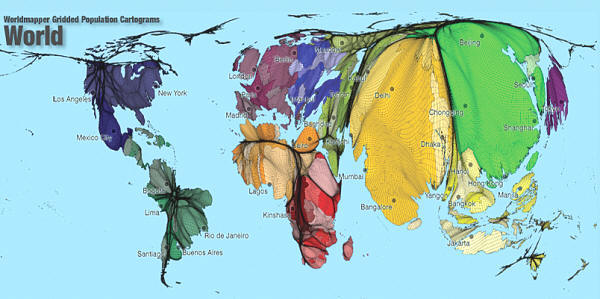
The Importance of Population
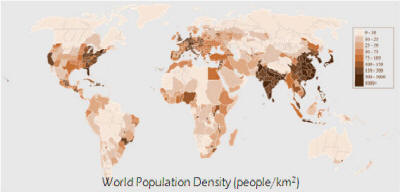
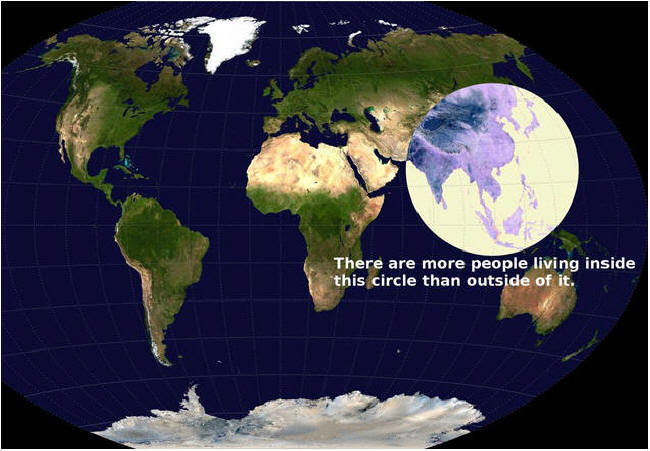
Did You Know? • 80% of the world’s population lives in developing nations. • 90% of the world’s population lives on <20% of the land area. • only one in nine people live south of the equator. • India will likely surpass China in population by 2020. • 1950-2000, the world’s population increased 140% (from 2.5 billion to 6 billion). • 99% of maternal deaths occur in developing nations (2,000/100,000 live births in LDC’s vs. 8/100,000 in MDC’s). • 100 million women are ‘missing’ due to infanticide and abortion. • By 2020, Europe will have more people >40 than <40. • 50% of the children in AIDS-infected African nations are orphans. • 50% of the sub-Saharan Africa population is age 14 or less. • A 2% annual population increase world-wide translates into nearly 4 more people each second.
Demographics matter. Population drives everything.
Population geography is a division of human geography. It is the study of the ways in which spatial variations in the distribution, composition, migration and growth of populations are related to the nature of places. Population geography involves demography in a geographical perspective. It focuses on the characteristics of population distributions that change in a spatial context, especially with reference to size and density, distribution and vital statistics (births, marriages, deaths, etc.). Population geography studies the following over space and time.
Demographic phenomena (natality, mortality, growth rates, etc) Increase or decrease in population numbers The movements and mobility of populations Occupational Structure Grouping of people in settlements The geographical character of places e.g. settlement patterns The way in which places in turn react to population phenomena e.g. immigration
Contemporary demographic concerns include the population explosion, the relationship between population and economic development, the effects of birth control, urban congestion, illegal immigration and labor force statistics. More recently, there is a concern over global population decline. Maternity wards are shuttering in Italy. Ghost cities are appearing in China. Hundreds of thousands of properties in Germany have been leveled and the land turned into parks. The world’s demographics are changing, pushing toward more deaths than births. Though some countries’ populations continue to grow, fertility rates are falling nearly everywhere else as women have gained more access to education and contraception. Demographers now predict that toward the middle of this century, the global population will enter a sustained decline for the first time. A planet with fewer people could ease pressure on resources, slow climate change and reduce burdens for women. But the data also points to changes that are hard to fathom: Fewer workers could upend the ways societies are organized and our ideas about family and nation. Demographic analysis can be applied to whole societies or to groups defined by criteria such as education, nationality, religion and ethnicity. In academia, demography is often regarded as a branch of anthropology, economics or sociology. Formal demography limits its study to the measurement of population processes, while the broader field of social demography population studies also analyzes the relationships between economic, social, cultural and biological processes influencing a population.
Theory
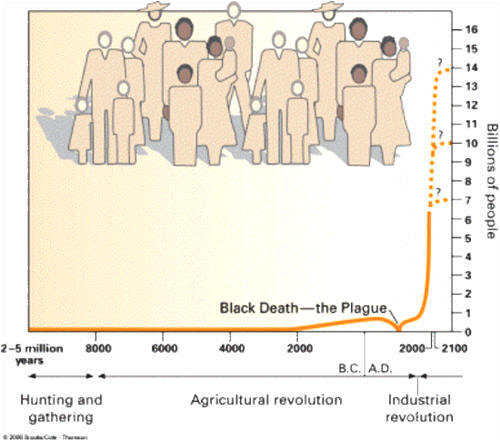
According to Thomas Malthus, preventative checks are those that affect the birth rate and include marrying at a later age (moral restraint), abstaining from procreation, birth control and homosexuality. Malthus, who worked as a clergyman in the Church of England, considered birth control and homosexuality to be vices and inappropriate (but nonetheless practiced). Positive checks are those that increase the death rate. These include disease, war, disaster and, when other checks don't reduce population, famine. Malthus felt that the fear of famine or the development of famine was also a major impetus to reduce the birth rate. He indicated that potential parents are less likely to have children when they know that their children are likely to starve. Malthus's ideas came before the industrial revolution and focused on plants, animals and grains as the key components of diet. Therefore, for Malthus, available productive farmland was a limiting factor in population growth (carrying capacity of the land). With the industrial revolution and the increase in agricultural production, land became a less important factor than it was during the 18th century. Contrary to Malthus' predictions, natural population growth in most developed countries has diminished to close to zero without being checked by famine or lack of resources. People in developed nations have shown a tendency to have fewer children. The fall in population growth has occurred despite large rises in life expectancy in these countries. This pattern of population growth, with slow (or no) growth in pre-industrial societies, followed by fast growth as the society develops and industrializes, followed by slow growth again as it becomes more affluent, is known as the demographic transition model.
Frank Notestein developed the theory in 1945 and suggested that there was a relationship between population change and industrial development. He suggested that with time, countries go through a linear evolution from traditional, non-industrial society to a modern, industrial and urban one. The original DTM has just four stages, however, some theorists consider that a fifth stage is needed to represent countries that have undergone the economic transition from manufacturing based industries into service and information based industries called deindustrialization. The model was based on the changes seen in Europe so those countries follow the DTM relatively well. However, in recent decades, many countries have reduced their growth rates dramatically without an increase in wealth. Similar trends are now becoming visible in more developing countries, so that far from spiraling out of control, world population growth is expected to slow markedly in the next century, coming to an eventual standstill or even declining. The change is likely to be accompanied by major shifts in the proportion of world population in particular regions. The UN Population Division expects the absolute number of infants and toddlers in the world to begin to fall by 2015 and the number of children under 15 by 2025. The UN projection shows world population reaching an approximate equilibrium at 9 billion by 2075. Working independently, demographers at the International Institute for Applied Systems Analysis in Austria expect world population to peak at 9 billion by 2070. Throughout the 21st century, the average age of the population is likely to continue to rise.
Population
Processes
|
|
Physical Factors |
High Density |
Low Density |
|
Relief |
Low land which is flat (Ganges Valley in India) |
High land that is mountainous (Himalayas) |
|
Resources |
Areas rich in resources (coal, oil, wood, fishing, etc) tend to be densely populated (Western Europe) |
Areas with few resources tend to be sparsely populated (the Sahel) |
|
Climate |
Areas with temperate climates tend to be densely populated as there is enough rain and heat to grow crops (UK) |
Areas with extreme climates of hot and cold tend to be sparsely populated (the Sahara Desert) |
|
Human Factors |
High Density |
Low Density |
|
Political |
Countries with stable governments tend to have a high population density (Singapore) |
Unstable countries tend to have lower population densities as people migrate (Afghanistan) |
|
Social |
Groups of people who want to live close to each other for security (US) |
Groups of people who prefer to be isolated (Scandinavians) |
|
Economic |
Good job opportunities encourage high population densities, particularly in large cities in MEDCs and LEDCs |
Limited job opportunities cause some areas to be sparsely populated (Amazon Rainforest) |
![]()

crude birth rate (CBR): number of births / 1,000 population
crude death rate (CDR): number of deaths / 1,000 population (also known as the mortality rate)
rate of natural increase (RNI) = CBR - CDR (35 / 1000 – 15 / 1000 = 20 / 1000 = 2%/year) (2% annual growth rate = doubling time of 35 years)
infant mortality rate: number of child deaths (0-1, 0-4 years) / 1,000 live births
maternal mortality rate: number of deaths / 100,000 live births
total fertility rate: number children actual / projected born to women of child bearing age based on recent history of child birth
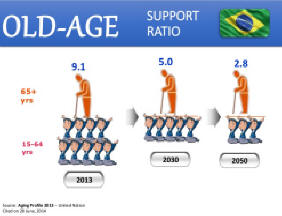
dependency ratio: number of people ages 0-14 and 65+ supported by those between 15 and 64
 old age index:
number of aged / number of adults × 100
old age index:
number of aged / number of adults × 100
doubling time: number of years for a country’s population to increase by 100% at current RNI
J-curve: profile of a population that expands geometrically or exponentially
ZPG: zero population growth
demographic equation: births – deaths + immigration – emigration
Malthusian dilemma: PG geometric; food supply arithmetic
population density: number of people / area (usually km2)
the rule of 70: a way to estimate the number of years it takes a population to double if you know the annual percentage growth rate
The population of the US with an annual population growth rate of 1% will double in about 70 years if the population growth rate remains at 1%. The population of the country of Mozambique, in southern Africa, with an annual population growth rate of 4% will double in 17.5 years, quadruple in 35 years and increase by a factor of 8 in 70 years if the population growth rate remains at 4%. So a small change in the population growth rate results in a significant increase in population.
![]()
I. Types of Migration
A. permanent or temporary
B. voluntary or forced
C. international or internal
II. Voluntary Migration
A. Push and Pull Factors
1. Any migration is a result of push forces at the origin and pull forces at the destination.
Researchers have long analyzed migration in terms of the push-pull model. This model differentiates between push factors that drive people to leave home and pull factors that attract migrants to a new location. Push factors occur within sending states, that is, those that send migrants abroad, while pull factors occur within receiving states, that is, states that receive immigrants from sending states abroad.
Push factors are negative aspects of the sending state, while pull factors are positive aspects of the receiving state. In fact, these differentiating factors are really two sides of the same coin. In moving migrants must not only find a lack of benefits at home (push factors) but also expect a surplus of benefits abroad (pull factors); otherwise the move would not be worthwhile.
There are also more ambiguous factors, called network factors that can either facilitate or deter migration. Network factors include cost of travel, the ease of communication, and international business trends. These factors are not related to a specific state, but still have a profound effect on international migration.
2. push factors: famine, war, poverty, crime, weather, drought, famine, lack of jobs, over population, civil war, etc
Sometimes these factors leave people with no choice but to leave their state of origin.
Lack of Jobs/Poverty: Economic factors provide the main motivation behind migration. In fact, approximately half of the total population of current international migrants left home to find better job and lifestyle opportunities for their families abroad. In some states, jobs simply do not exist for a great deal of the population. In other instances, the income gap between sending and receiving states is great enough to warrant a move.
For example, many graduates from Indian universities migrate to the US, where their skills and lower wage demands appeal to high-tech companies. Similar trends apply to low skilled migrant laborers, who may leave home states due to lack of demand and/or low wages for their work and excess need for this kind of work elsewhere. The influx of low skilled laborers from Latin America to the US to accommodate the growing service sector provides an example of this form of labor migration.
Civil Strife/War/Political and Religious Persecution: Some migrants are impelled to cross national borders by war or persecution at home. These immigrants may be considered refugees or asylum seekers in receiving states. The 1951 Geneva Convention Relating to the Status of Refugees defined the qualifications for such migrants and bound signatory states not to return these newcomers to places where they could be persecuted. According to the text put forth by the Convention, a refugee is “someone who is unable or unwilling to return to their state of origin owing to a well-founded fear of being persecuted for reasons of race, religion, nationality, membership of a particular social group or political opinion.”
 The
Syrian Civil War, which began in the spring of 2011, provides an extreme example
of the relationship between internal violence and the emigration of refugees.
The war has included horrific violence between government forces and rebel
groups attempting to overthrow the Assad regime, resulting in more than 80,000
deaths as well as extensive human rights atrocities. As a result of the
deteriorating conditions in Syria, which include the alleged use of chemical
weapons, torture, civilian massacres and so on, Syrian citizens have fled in
mass numbers. These numbers have drastically increased as circumstances have
become more dire.
The
Syrian Civil War, which began in the spring of 2011, provides an extreme example
of the relationship between internal violence and the emigration of refugees.
The war has included horrific violence between government forces and rebel
groups attempting to overthrow the Assad regime, resulting in more than 80,000
deaths as well as extensive human rights atrocities. As a result of the
deteriorating conditions in Syria, which include the alleged use of chemical
weapons, torture, civilian massacres and so on, Syrian citizens have fled in
mass numbers. These numbers have drastically increased as circumstances have
become more dire.
Despite the existence of real conflicts such as the Syrian Civil War, however, the governments of many developed states continue to treat would-be refugees and asylum-seekers as economic migrants looking for an easier way to escape poverty in the developing world. For example, the US has declared that Haitian emigrants are fleeing because of widespread impoverishment rather than the social and political strife that plague Haiti. As a result, the US government does not afford certain privileges allocated to refugees to all Haitians arriving in the US. If Haitian immigrants come to the US through unauthorized channels, which many do, they must pass a rigorous examination of their qualifications as refugees or asylum-seekers and if they fail, they are returned to Haiti.
Conversely, refugees from Cuba have encountered a far more welcoming reception in the US during much of the 20th century, though less so in the post-1980 period. This may be due, in part, to the political strife between the US and the communist government in Cuba, and the resulting willingness of the US government to accept refugees of communism. Haitian-Americans and their supporters have protested what they call an unfair distinction in treatment of the two groups, while the US government maintains that Haiti, though not a perfect democracy, is not a dictatorship such that Haitians deserve immediate consideration as refugees.
Studies suggest that refugees have been able to better assimilate into the U.S. economy than traditional economic migrants. This may be due to the fact that refugees are more likely to expect a longer stay in their state of resettlement, therefore increasing the incentive to invest in skills that will allow them to take advantage of long-term economic opportunities. However, this trend may also be related to resettlement programs and other privileges allocated to refugees (like Cuban migrants in the US) that often aren’t available to other immigrants. Regardless of the reason behind it, this finding contradicts the popular notion that refugees exact a serious financial or resource-draining burden on their state of resettlement.
Environmental Problems: Environmental problems and natural disasters often cause the loss of money, homes and jobs. In the middle of the 19th century, for example, Ireland experienced a famine never before seen in the state’s history. By late fall 1845, the main staple of the Irish diet, the potato, was practically wiped out. With the government not clear on how to respond, many people died of starvation. The famine killed hundreds of thousands and forced millions of Irish to flee. Between 1841 and 1851, the Irish population decreased by 1.6 million people, or approximately 17% of the total population, due to starvation and emigration.
More recently, the term “environmental refugee” has been adopted to describe migrants fleeing environmental disasters. Environmental refugee describes people who have been forced to leave their traditional habitat, temporarily or permanently, because of a marked environmental disruption (natural and/or triggered by humans) that jeopardizes their existence and/or seriously affects the quality of their life. Ninety-eight percent of this displacement is caused by climate- and weather-related disasters, especially flooding. While developing states tend to be disproportionately affected by such displacement, often due to “compounded vulnerability” of repeated natural disasters and difficulty rebuilding infrastructure and protections for the future, wealthy states also suffer considerable environmental-induced displacement.
A growing cause of environmental refugees is
desertification, leading to crop failure and water shortage, but that’s only one
in a long list. Governments must be able to foresee and respond to these
environmental issues, requiring time, money and organization. Since many of the
states most gravely affected by environmental disasters and resulting migration
are in the developing world, they may lack resources to adequately address the
detrimental effects of these crises.
Other push factors include primitive conditions, natural disasters, poor medical care, as well as slavery and political fear.
3. pull factors: availability of food, peace, wealth, cost of living, better health care, employment, education
Whereas push factors drive migrants out of their states of origin, pull factors are responsible for dictating where these travelers end up. The positive aspects of some states serve to attract more immigrants than others.
Higher standards of living/Higher wages: Economic incentives provide both the biggest push and pull factors for potential migrants. People moving to more developed states will often find that the same work they were doing at home is rewarded abroad with higher wages. They will also find a greater safety net of welfare benefits should they be unable to work. Migrants are drawn to those states where they can maximize benefits.
For example, Mexican migrants coming to America do not move strictly to escape unemployment at home. They may come to the US because they are attracted by the higher hourly wages, rather than the opportunity to find employment in general.
Labor Demand: Almost all developed states have found that they need migrants’ low skill labor to support their growing economies. While most manufacturing is now outsourced to developing states, low skill employment opportunities are available in wealthy states due to growing service sectors. These economies create millions of jobs that domestic workers often refuse to fill because of their low wages and minimal opportunity for professional advancement. Canada is an example of this trend; the state’s migrant population has nearly doubled over the past couple of years.
Political and Religious Freedom: Much like discrimination and persecution provide strong push factors for people to leave their home states, the existence of tolerant government policies with regards to religion, race, political views and so on may make certain states more attractive to potential migrants. This pull factor is especially relevant to those migrants who are escaping situations of persecution (and may be considered refugees) though it can apply to other migrants as well.
With the expansion of telecommunications technology that has accompanied globalization, migrants have found it drastically easier to stay connected with the religious community that they left behind in their home state, thus making the decision to move away from home an easier one. In places where this transnational religion is promoted through financial institutions, sister congregations, community organizations, telecommunications infrastructure and governmental tolerance, migration by religiously devout persons has followed. For example, a large Muslim community with strong ties to religious leaders and congregations in Pakistan and Bangladesh has sprung up in Britain; they have used their freedom of religious association to press local authorities for changes in religious rights and education.
Other pull factors include superior medical care or education, family links or simply a personal fondness of a certain place, whether it may be linked to culture, language, weather conditions or other influencing factors.
B. Intervening Obstacles
1. monetary cost
2. distance
3. psychic cost
4. personal factors
5. others
III. Consequences of Migration
A. Demographic
1. Changes in the numbers and distribution of people within a region are changed.
2. Intermarriages are created, leading to a new group of people.
B. Social
1. Migration brings different people together leading to conflicts.
2. Migration also creates understanding between different groups of people.
3. Rural-Urban migration creates ghettoes in cities.
C. Economic
1. Depends on the quality (skills, age, educational attainment, health etc) of the migrants and the economic needs of the origin and destination.
2. In over populated areas, emigration is beneficial because it reduces the pressure on the land.
3. In under populated areas, emigration may slow down development.
IV. Immigration to the United States
A. Causes
1. Lifting of restrictive policies prior to World War II
2. War refugees from Europe (World War II), Korean and Vietnam Wars
3. Political refugees from Communist takeovers in Cuba and Southeast Asia
4. Immigration Act of 1965 ended the ethnic quotas of the 1920s that favored Europeans
5. Rise in legal immigrants from Latin American and Asian countries
6. Post-World War II search for work/higher wages
7. 1942–1964: Bracero Program, agricultural program to bring Mexicans to the US
8. US church groups and others gave support to immigrants coming to US

9. War Brides Act of 1945: authorized the limited admission of the wives and children of citizens honorably discharged or serving in US armed forces
10. Immigration and Nationality Act of 1952 (McCarran–Walter Immigration Act)
o Reaffirmed the national origins quota system
o Abolished the ban on most Asian immigrants; people from all nations given the opportunity to enter the U.S. (repealed the Chinese Exclusion Act of 1882)
o Barred homosexuals and people considered subversive from entering the US
11. Immigration and Nationality Act of 1965
o Abolished the national origins quota system
o Allowed 120,000 immigrants from Western Hemisphere
o Allowed 170,000 immigrants from Eastern Hemisphere
o Established preferences for professionals and highly skilled workers
12. 1977 amendment to the Immigration and Nationality Act abolished separate immigration quotas for the Western and Eastern Hemispheres
13. Refugees Act of 1980 reduced the worldwide quota to 270,000 immigrants
14. Technological improvements in land and air travel decreased costs of travel
B. Consequences
1. Shift in areas of origin
o Prior to 1960s, the majority of immigrants were from Europe and Canada.
o By the 1980s, 47% of immigrants came from Latin America, 37% from Asia, and less than 13% from Europe and Canada.
2. Post–World War II immigrants have included more women and persons who are more educated and who have higher skills.
3. Increase in immigration each year since 1945
4. Immigrants accounted for 60% of the US population growth according to the 1990 census.
5. Two-thirds of immigrants settled in New York, California, Florida, New Jersey, Illinois and Texas.
6. Many Americans have become increasingly concerned about the number of immigrants coming to the US.
7. Increase of illegal immigrants from Latin America
8. Anti-immigration sentiment has intensified, especially with regard to Latinos.
9. Some in the anti-immigration movement have supported efforts to make English the official language.
10. Interracial tensions have arisen between African Americans and Latinos.
11. After 1965 developing nations replaced Europe as the major source of immigrants.
12. Immigration Reform and Control Act of 1986 (Simpson–Rodino)
o Granted amnesty to illegal immigrants arriving before 1982
o Penalized employers for hiring illegal immigrants
13. In 1989 Congress passed legislation authorizing work permits and granting refugee status to Central Americans.
14. Shifting patterns of immigration have produced a more multicultural society.

V. Ravenstein's Laws of Migration (E.G. Ravenstein)
A. Most migrants move only a short distance.
B. There is a process of absorption, whereby people immediately surrounding a rapidly growing town move into it and the gaps they leave are filled by migrants from more distant areas, and so on until the attractive force [pull factors] is spent.
C. There is a process of dispersion, which is the inverse of absorption.
D. Each migration flow produces a compensating counter-flow.
E. Long-distance migrants go to one of the great centers of commerce and industry.
F. Natives of towns are less migratory than those from rural areas.
G. Females are more migratory than males.
H. Economic factors are the main cause of migration.
VI. Insights from the Latest Migration Research
A. Adjusted for population growth, the global migration rate has stayed roughly the same since around since 1995 (it was higher from 1990-1995).
B. It’s not the poorest countries sending people to the richest countries, it’s countries in transition - still poor, but with some education and mobility - that are the highest migratory contributors. As countries develop, they continue to send more migrants, and at some point they become migrant-receiving regions.
C. The largest regional migration is from Southeast Asia to the Middle East. This is largely driven by the huge, oil-driven, construction booms happening on the Arabian Peninsula.
D. The biggest flow between individual countries is the steady stream from Mexico to the US. In fact, the US is the largest single migrant destination.
E. There’s a huge circulation of migrants among sub-Saharan African countries. This migration dwarfs the number leaving Africa, but the media pay more attention the latter.
[We'll take another look at migration when we look at culture.]
![]()
 Sustained reductions in family size were first witnessed in late 18th century Europe. In the first half of the 20th century, European countries had another demographic first: non- catastrophic sub-replacement fertility. During the interwar period, a number of European states reported fertility patterns that, if continued, would lead to an eventual stabilization and indefinite population decline from then on, absent offsetting immigration. Such low birth rates had virtually always been a function of war, pestilence, famine or disaster. These low fertility patterns were entirely voluntary. Europe experienced a baby boom after World War II, but sub-replacement fertility has now returned with a vengeance.
To maintain long-term population stability, a society’s women must bear an average of about 2.1 children per lifetime. According to projections of the US Census Bureau, Europe’s total fertility rate is about 1.4. In fact, nearly all the world’s developed regions — Australia and New Zealand, North America, Japan and the highly industrialized East Asian outposts of Singapore, Hong Kong, Taiwan and South Korea — are reporting sub-replacement fertility. (Israel remains an exception.) But sub-replacement fertility is no longer a developed-nation phenomenon. If the Census Bureau’s projections are roughly accurate, just about half the world’s population lives in sub-replacement countries or territories.
Apart from Mongolia, according to the Census Bureau, all of East Asia is sub-replacement, as are Thailand and Burma in Southeast Asia, Kazakhstan and Sri Lanka in South-Central Asia, many Caribbean societies and most South American countries. Perhaps the biggest surprise, given current views of the Arab/Muslim world, is the recent spread of sub-replacement fertility to parts of the Arab and the Muslim world. Algeria, Tunisia and Lebanon are now sub-replacement countries, as is Turkey. And there is the remarkable case of Iran, with a current TFR of under 1.9, which is lower than the US. Between 1986 and 2000, the country’s TFR plummeted from well over 6 to just over 2. If modernization and Westernization are connected to sustained fertility decline, as is often supposed by demographers, both terms are apparently being given a new meaning.
There are no reliable methods for anticipating just how low fertility levels may sink or how long sub-replacement fertility may persist in various places. One consequence, however, is already clear: it will force an aging of the populations affected. All of the developed countries are already graying. This is most pronounced in Japan, where, by the year 2025, it is expected that one out of nine people will be 80 or older. Japan’s prospective aging is unprecedented and the scale of the transformation suggests the enormousness of the challenges that will accompany it. Japan, Europe and North America are places where people traditionally got rich before they got old. In the decades ahead, many national populations are going to get old before they get rich.
China promises to be the most important case in point. Thanks to low levels of mortality, its population control program and its now low fertility, China is aging at a breathtaking velocity. Between 1975 and 2000, China’s median age jumped from just over 20 to about 30; by 2025, it is projected to rise by nearly another decade. By then, it is quite possible that China’s median age will be higher than America’s. But China is much poorer than Japan or the US were at every comparable stage of their aging processes. China’s rapidly aging population faces a problem. Apart from the family, China lacks any functional nationwide arrangements for pensioning its elders. Thus, a great many Chinese will have to continue to work into old age. But working life in China typically entails more physical labor, which does not favor the frail, than work in Japan or the US. China’s aging problem has the makings of a humanitarian tragedy.
China is also witnessing a growing disproportion between its numbers of baby boys and baby girls, and it is not the only country in which this is happening. In ordinary human populations, around 104-105 boys are typically born for every 100 girls. However, since the advent of its coercive one-child policy, China has broken this natural biological rhythm. China's 1982 census counted almost 109 baby boys for every 100 baby girls; by 1995 the reported ratio was up to almost 116 boys for every 100 girls; and by 2000 it was 120:100. This astonishing ratio could be a consequence of massive statistical falsification as parents bend the rules of the population program by concealing baby girls. If so, one would expect to see more normal sex ratios at slightly older ages: say, the years 1-4. But even here, China’s registered ratio of boys to girls was about 121:100, and the ratio exceeded 130:100 in several provinces.
 The imbalances did not emerge until after China’s population control program was implemented in the late 1970s, and the imbalances have grown progressively worse during the years since. Yet this policy cannot be the sole culprit. In other parts of East Asia, including South Korea, Taiwan, Hong Kong and Singapore — none of which forcibly control population growth — unnatural gender imbalances at birth have also been recorded in recent years. It may be that throughout East Asia we are witnessing a collision between an immensely strong cultural preference for sons, sub-replacement fertility and the availability of ultrasound and other technologies that permit prenatal gender determination. Skewed sex ratios at birth would be the inexorable consequence.
And the collision is not only happening in East Asia. Gender determination technology is now nearly universally available; sub-replacement fertility is fast becoming the planetary norm; and a strong preference for sons has been expressed in a number of cultures worldwide. One of these is Punjab, India. In a major survey undertaken there a decade ago, when fertility levels were still well above replacement, women expressed a preference for a boy over a girl 10:1. According to India’s latest census, in that state’s youngest age groups, there were 126 young boys for every 100 young girls. That figure cannot be taken as an exact indication of gender imbalance at birth: differential mortality and/or migration, for instance, may have affected the outcome.
Contrary to expectation, with increased affluence, education and contact with the outside world in these areas, the gender imbalance has increased. It is starting to do the same in the Caucasus; parts of Latin America and Eastern Europe; even in subpopulations within the US. The consequences of this growing gender imbalance will be felt when these children grow to be prospective husbands and wives. The marriage market will be unable to clear in locales where matrimony is the expectation, sub-replacement fertility the reality and extreme gender imbalances the norm.
It has generally been assumed that with improved income, increased globalization and the spread of ideas, knowledge and technology, mortality would gradually decline worldwide and countries’ mortality levels would gradually converge. Most of the 20th century seemed to confirm such expectations. Between 1900 and 2000, global life expectancy at birth probably doubled, soaring from about 30 to well over 60 years. And from 1950 to 1980, there was a marked convergence of life expectancy between the more and less developed nations.
In the 21st century, it appears that major and pervasive health setbacks will be a characteristic feature of the global population profile. These steep increases in mortality do not seem to be transitory and will probably continue for decades. By US Census Bureau projections, over 40 countries are anticipated to have a lower life expectancy in 2010 than they did in 1990. The Bureau envisions a 20-year-long decline in life expectancy for those countries. Clearly, these are not trivial interruptions.
Most of the health setbacks relate to HIV/AIDS, which is a problem in virtually all of these reversals in sub-Saharan Africa. But it is not the only, or even the major, factor elsewhere. Most of the former Soviet countries, for example, are projected to suffer long-term declines in life expectancy.
The Russian Federation is perhaps the most striking and unexpected of the states suffering from long-term health decline. Russia’s life expectancy at birth today is about four years lower than it was forty years ago. Its health reversal is concentrated in working age groups. This peacetime death explosion has been triggered not by tuberculosis or HIV/AIDS, but by cardiovascular disease and injuries. Alcohol, of course, has played its part … one Russian study determined that almost half of the young and middle aged men who died of injury or cardiovascular disease were drunk at the time of death. Russians now in their 30s, 40s or 50s have already accumulated a lifetime of insults to their health.
In Japan, each new generation enjoys better survival chances at any given age. The situation is different in Russia, where the worst death rates at any given age are found among the youngest men. To judge by mortality, Russians are now less healthy than their parents were at the same age. Under such circumstances, it will be extraordinarily difficult to improve the health of the society as a whole.
A final surprise involves what we might call America’s demographic exceptionalism. The US is the singular and major exception to the demographic paterns characterizing virtually all other affluent Western states.
In Western Europe, total populations are anticipated to decline between 2000 and 2025, with a substantial shrinkage in the under-55 population and pronounced population aging. In the US, overall population aging is much more moderate. The overall population is projected to increase and a higher number of young people are expected in 2025 than today.
Part of this difference is attributable to a significant divergence in fertility patterns. As already noted, Europe’s overall TFR stands at 1.4-1.5 – with Italy and Spain on the low end (1.2) and France and Ireland on the high end (1.8). The US fertility rate has been over 2.0 since 1990 and is just under replacement today— somewhere between 2.0 and the 2.1 replacement level, making it about 40% higher than Europe’s.
America’s fertility levels have diverged not just from Europe’s but from those of the rest of the developed world. The US TFR is much higher than Japan’s 1.3-1.4 and the gap is even greater with some of the other high-income East Asian countries. The US and Canada had nearly identical fertility levels back in the mid-1970s but Canada looks pretty European today. While the US is reporting a TFR of over 2, Canada’s is around 1.5. Much of the developed world is in what Ron Lesthaege and Dirk van de Kaa have dubbed the second demographic transition — a shift to smaller desired family sizes and less stable family unions. If this is the new demographic revolution, Americans look to be the developed world’s most prominent counterrevolutionaries.
America’s relatively high TFR does not seem to be explained by any particular region or ethnicity. There are big fertility differences between some states, but 42 states reported TFRs above 1.9 and 33 reported TFRs of 2.0 or higher. In all of Europe, by contrast, the only country with an estimated TFR above 2.0 is Albania.
America’s ethnic fertility differentials do not account for its demographic divergence from Europe. Hispanic Americans maintain relatively large family sizes in the US, with a TFR of around 2.7, but excluding them by no means eliminates the gap between the US and the rest of the developed world. Nor can the differential be explained by factoring out African-American fertility (which is higher than the Anglo rate, but much closer to the Anglo rate than to the Latinos’). In 2000, America’s Anglo TFR was 1.84 — about 10% less than the US national average, but still more than 30% above Europe’s.
No obvious materialist explanation for America’s demographic exceptionalism seems to exist. US-Western Europe income differences are not tremendous. One might think that fertility would be higher in societies that devote more public resources to child support, but social welfare programs are far more generous in most of Western Europe than in the US.
So how can we explain this fertility discrepancy? Possibly it is a matter of attitudes and outlook. There are big revealed differences between Americans and Europeans regarding a number of important life values. Survey results point to some of these. Americans tend to identify the role of government as providing freedom, while Europeans are inclined to think of government in terms of guaranteeing one’s needs. Attitudes about individualism, patriotism and religiosity seem to separate Americans from much of the rest of the developed world. Is it entirely coincidental that these divergences seem to track with the big cleavages between fertility levels in the US and so much of the rest of the developed world?
The difference between a TFR of 2.0 and one of 1.5 or 1.4, other things being equal, is the difference between virtual long-term population stability and a population that shrinks by almost a third with each passing generation. A UN Population Division study looked at what levels of net immigration flows would be necessary for developed countries to maintain both their overall population and their working-age population (15-64 years of age) over a 55-year time horizon. For the EU, a net inflow of about 2.5 million people a year would be needed to stabilize the population, and about 4.3 million to stabilize the workforce. But net immigration into the EU in the late 1990s averaged just 700,000 a year. For Japan, 300,000 net newcomers a year would be needed for population stability, and 600,000 for workforce stability. But Japan’s net immigration rate today is approximately zero. The US could maintain its population with just 116,000 net immigrants a year, but net annual immigration has averaged nearly 1 million. If these trends continue, America will age much more slowly than Europe or Japan and the US share of world population will not diminish steadily and dramatically in the decades ahead as Europe’s and Japan’s seem set to do.
Western European countries accounted for about 12% of global population in 1950; this was down to about 6% by 2000, and in the tentative Census Bureau projections for 2050, it is placed at barely 4%. Over this same span, Russia’s projected share of world population falls from over 4% to barely 1%; Japan’s from 3% to 1%. The US, on the other hand, only drops from about 6% in 1950 to about 4.5% in 2000 and then is projected at an almost constant 4.5% for the following half century.
While the rest of the developed areas gradually drop off the roster of the world’s major population centers, the US actually rises, from fourth largest in 1950 to third largest in 2000, which it is projected to remain in 2050 as well. Drawing international implications from such crude comparisons is hazardous. But from a purely demographic standpoint, the US, virtually alone among developed nations, does not look set to be going off gently into the night
Watch on the West: Four Surprises in Global Demography - FPRI
RECENT CHANGES IN US POPULATION TRENDS:
A recent decline in the US birthrate is partly a reflection of American society’s failure to support families. American couples are choosing to have no children or fewer children than they would like. There are now more Americans 80 and older than 2 or younger. I don’t know of any precedent for a dynamic country that has basically stopped growing.
![]()
The Demographic Transition Model (DTM) is a model used to explain the process of shift from high birth rates and high death rates to low birth rates and low death rates as part of the economic development of a country from a pre-industrial to an industrialized economy.
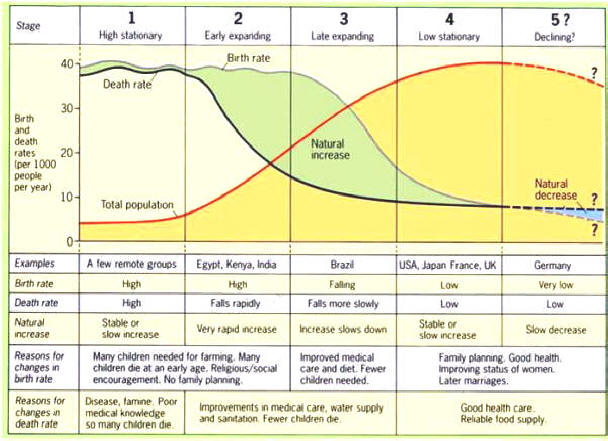
In stage 1, pre-industrial society, death rates and birth rates are high and roughly in balance.
In stage 2, that of a developing country, the death rates drop rapidly due to improvements in food supply and sanitation, which increase life spans and reduce disease. These changes usually come about due to improvements in farming techniques, access to technology, basic health care and education. Without a corresponding fall in birth rates this produces an imbalance and the countries in this stage experience a large increase in population.
In stage 3, birth rates fall due to access to contraception, increases in wages, urbanization, a reduction in subsistence agriculture, an increase in the status and education of women, a reduction in the value of children's work, an increase in parental investment in the education of children and other social changes. Population growth begins to level off.
During stage 4 there are both low birth rates and low death rates. Birth rates may drop to well below replacement level leading to a shrinking population, a threat to many industries that rely on population growth. As the large group born during stage two ages, it creates an economic burden on the shrinking working population.
The original model has only four stages. However, some theorists believe a 5th stage is needed to represent countries that have undergone the economic transition from manufacturing based industries into service and information based industries and whose populations are now reproducing well below replacement levels.
What is the Demographic Transition Model?
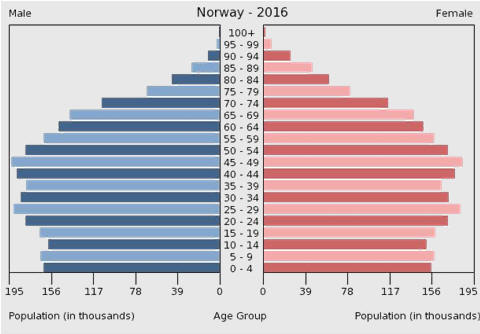
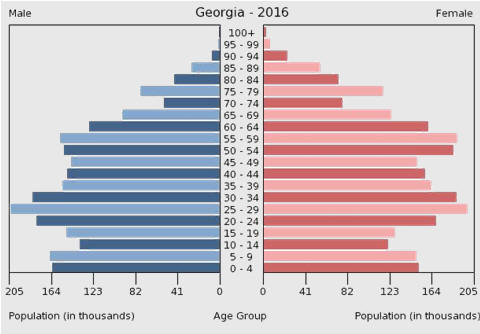
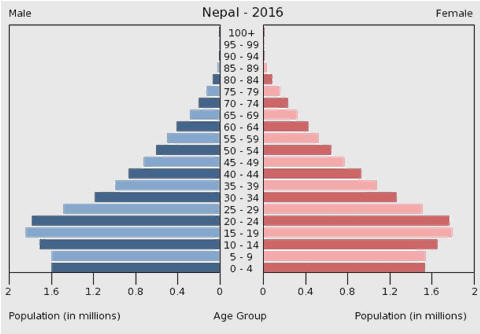
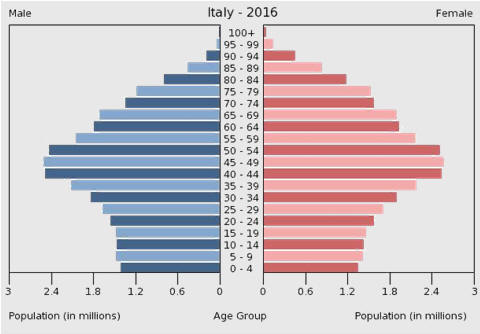
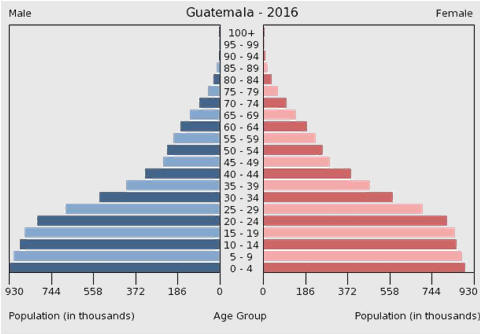
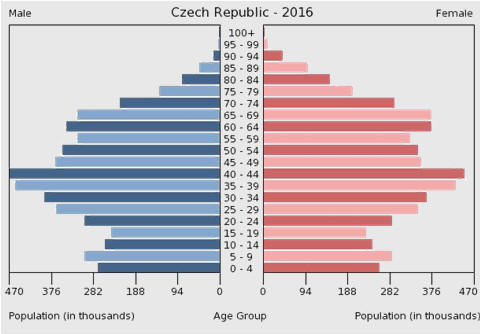
A population pyramid is a graphic illustration that shows the distribution of various age groups in a population, which normally forms the shape of a pyramid. It typically consists of two back-to-back bar graphs, with the population plotted on the X-axis and age on the Y-axis, one showing the number of males and one showing females in a particular population in five-year age groups (also called cohorts). Males are conventionally on the left, with females on the right. Measurements may be by raw numbers or as percentages of the total population.
Below are population pyramids representing the 1st four stages of the DTM.
There are three key types of population pyramids:
Rapid Growth: a triangle-shaped pyramid reflecting a high growth rate
Slow Growth: growth rate is shown in the more square-like structure of the pyramid
Negative Growth: As negative growth in a country continues, the population shrinks and may even begin to resemble an upside-down pyramid.
Generally a country has a young population if its population pyramid displays a population percentage of ages 1-14 over 30% and of ages 75 and above less than 6%. This usually occurs in developing countries, with a high agricultural workforce. A country whose pyramid displays a population percentage of ages 1-14 less than 30% and of ages 75 and above more than 6% has an aging population (usually occurring in developed countries with adequate health services).
Look at the animated US population pyramid from 1950 to 2050 that shows the aging of the boomers.
You can also create your own pyramids and tables for almost any country in the world using current and projected population from the US Census Bureau.
In the US, the population is growing at a rate of about 1.7% annually. This growth rate results in a more square-like structure in our pyramid. A lump in the pyramid between the ages of about 35 to 50 represents the post-WW II baby boom. As this cohort ages and climbs up the pyramid, there is a much greater demand for medical and other geriatric services.
Additional pyramids:
When looking at any country, ask yourself the following.
1) Overall, what is the population paradox?
2) What are the main social, environmental and economic challenges?
3) What is the shape of the population pyramid?
4) How does the age and sex structure influence the social, environmental and economic challenges?
5) Where is it in terms of demographic transition?
6) What are the intergenerational issues?
![]()
![]()
United Nations Population Division
Population pyramids and other population graphics
Animation of population growth 1950 to 2050 in China.
Animation of U.S. population growth from 1950 to 2050.
Animation of total fertility by life expectancy in China, India and the USA, 1950-2050.
International Data Base (IDB) Main
Consortium for International Earth Science Information Network (CIESIN)
State and County Quick Facts: quick, easy access to facts about people, business and geography – excellent source of information on US/State/County populations
Country - population growth rates 2000-2050
Population Connection (formerly ZPG, Zero Population Growth)
United Nations Statistics Division
Sources of Demographic Data on the Web
British Society for Population Studies Links
Economic Commission for Latin America and the Caribbean
Demography and Population Studies
Noncitizens Under Age 35, by MSA 2010-12
![]()
|
|


 Thomas Robert Malthus hypothesized that because of the natural human urge to reproduce human population increases geometrically (1, 2, 4, 16, 32, 64, 128, 256, etc.). However, food supply, at most, can only increase arithmetically (1, 2, 3, 4, 5, 6, 7, 8, etc.). Therefore, since food is an essential component to human life, population growth in any area or on the planet, if unchecked, would lead to starvation. However, Malthus also argued that there are preventative checks and positive checks on population that slow its growth and keep the population from rising exponentially for too long. Despite checks, Malthus predicted that poverty was inescapable and would continue.
 The demographic transition model (DTM) is a model used to represent the process of explaining the transformation of countries from high birth rates and high death rates to low birth rates and low death rates as part of the economic development of a country from a pre-industrial to an industrialized economy. It is based on an interpretation begun in 1929 by the American demographer Warren Thompson of prior observed changes, or transitions, in birth and death rates in industrialized societies over the past two hundred years. The various stages of the DTM determine the age composition of a population. They also determine a population's growth rate.